AI Investment Calculator
Enter what you have, what you can add each month, and how long you plan to invest. You'll get a projected balance, a growth chart, and an AI-generated breakdown of what's actually driving your results.
AI INVESTMENT CALCULATOR
CHOOSE YOUR GOAL
INVESTMENT DETAILS
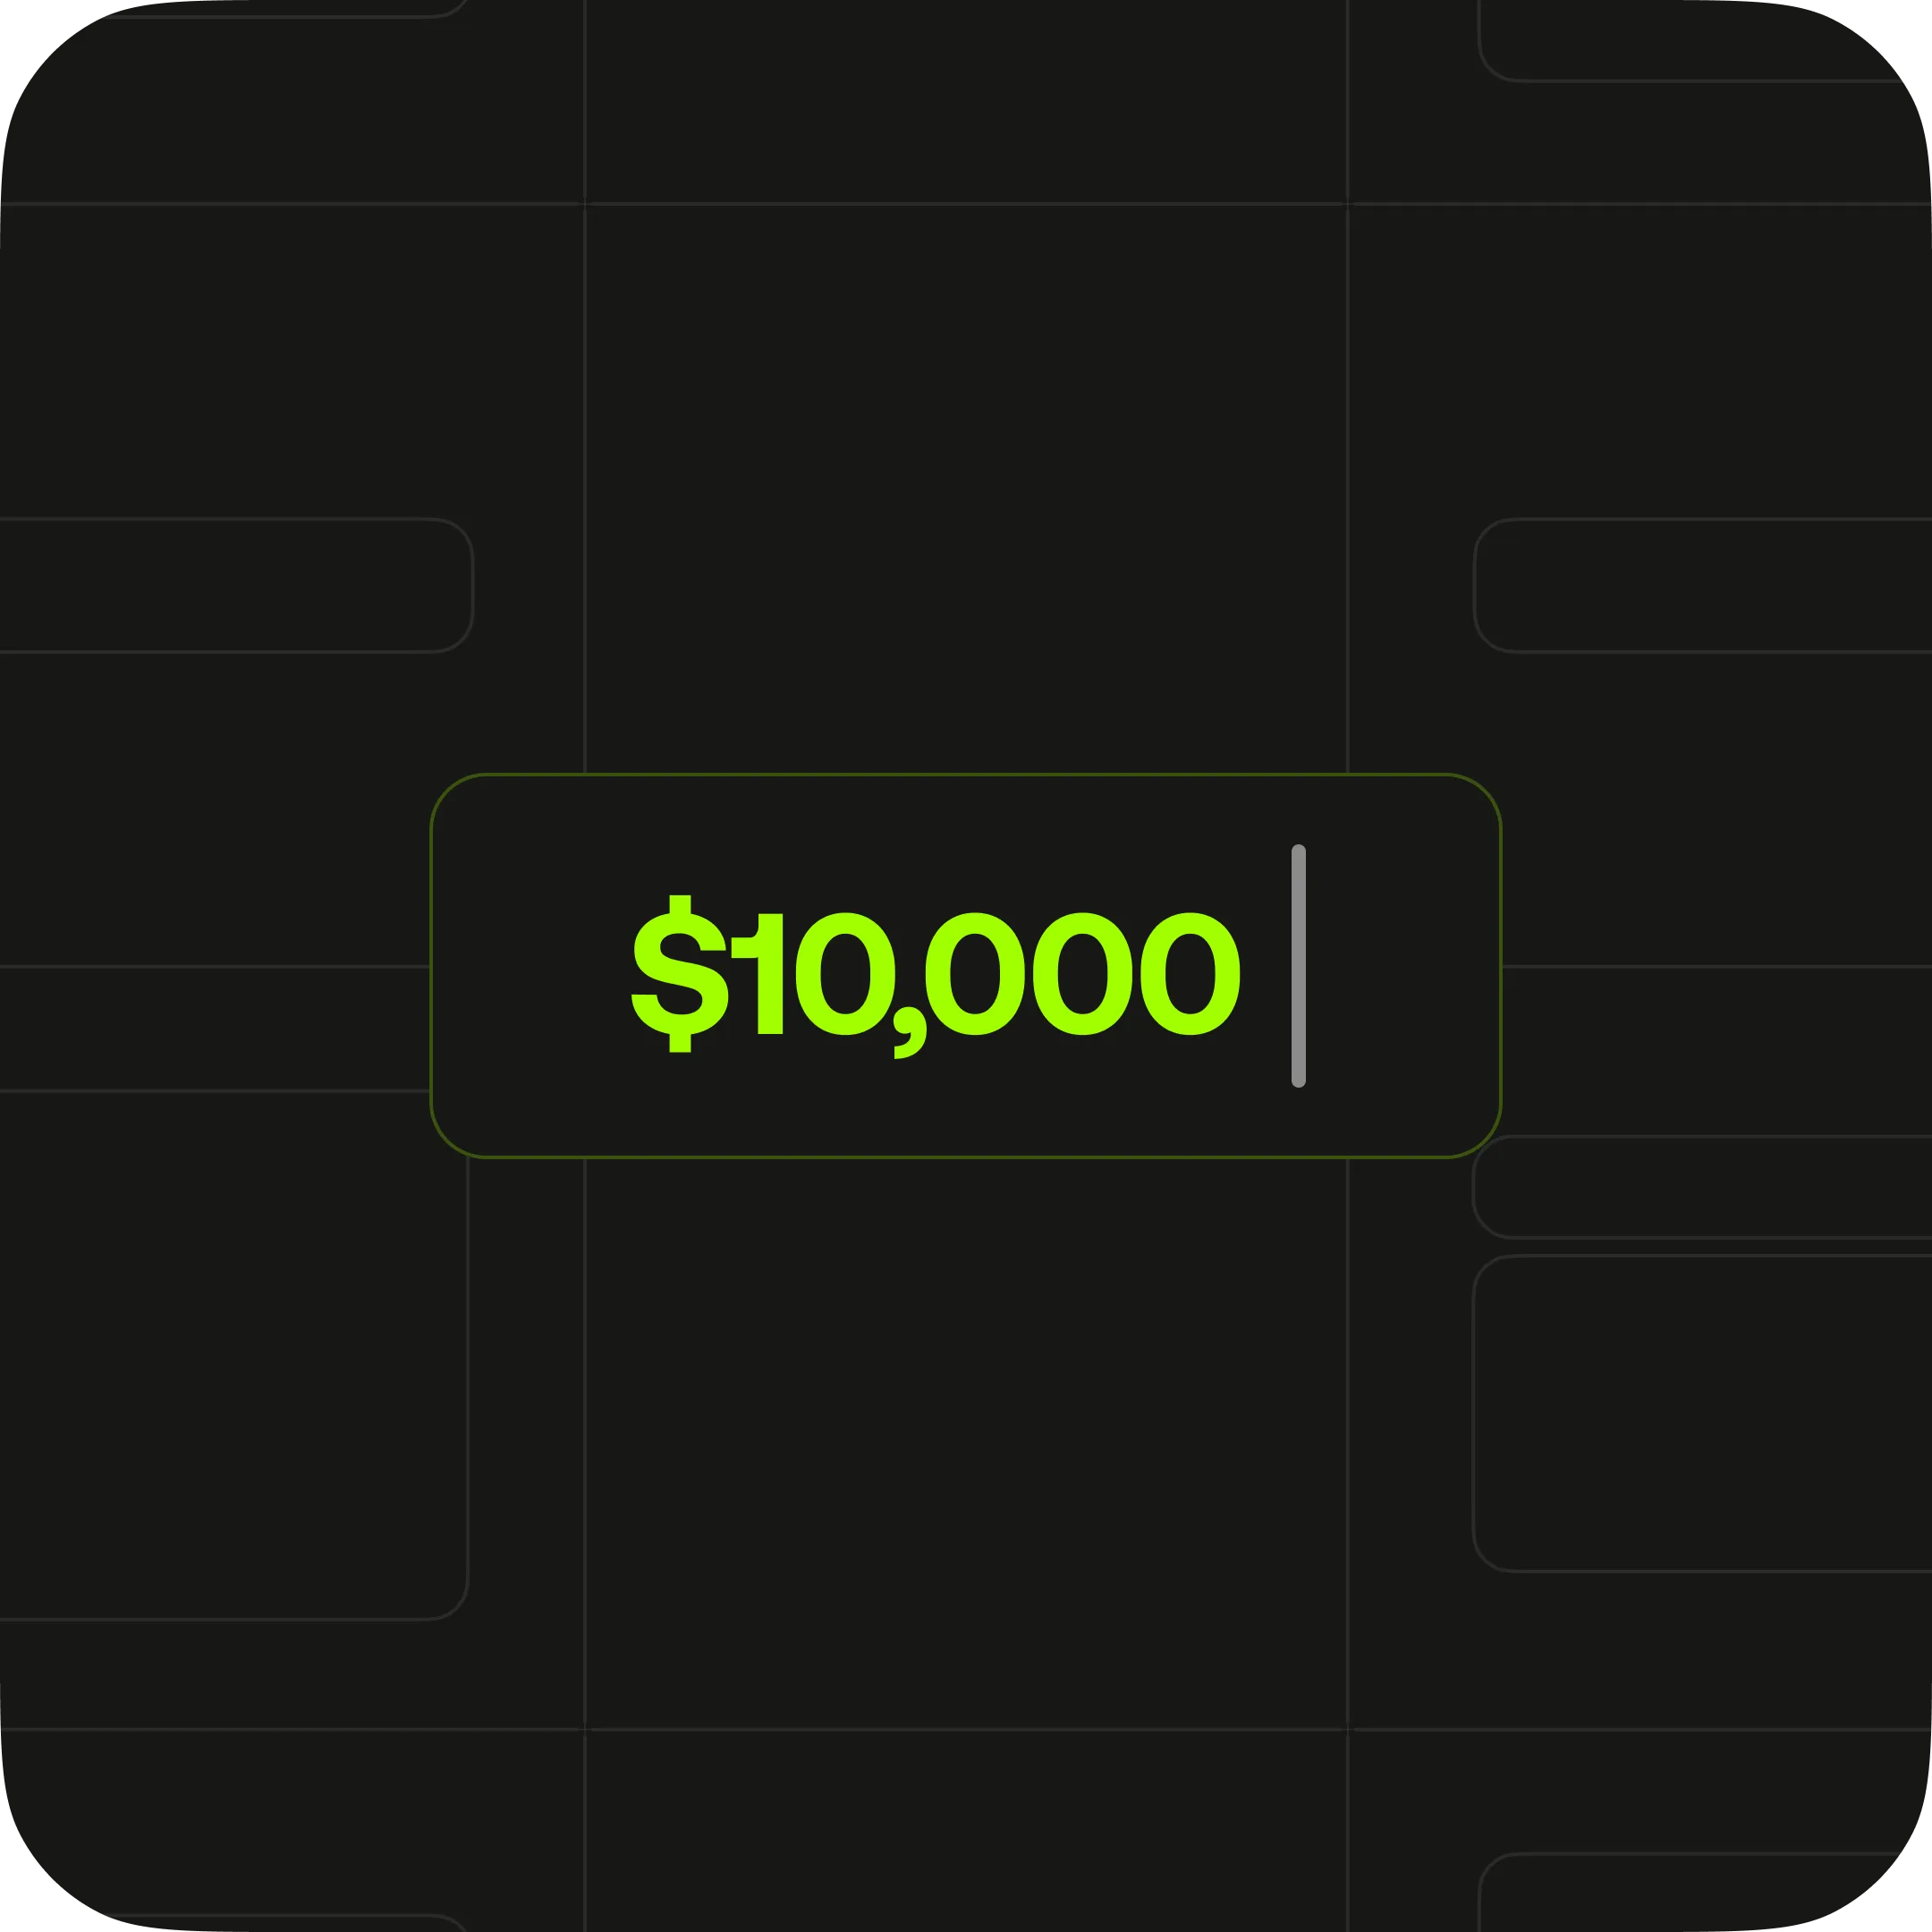
Step 1
Enter your starting amount
Zero is fine if you haven't begun.
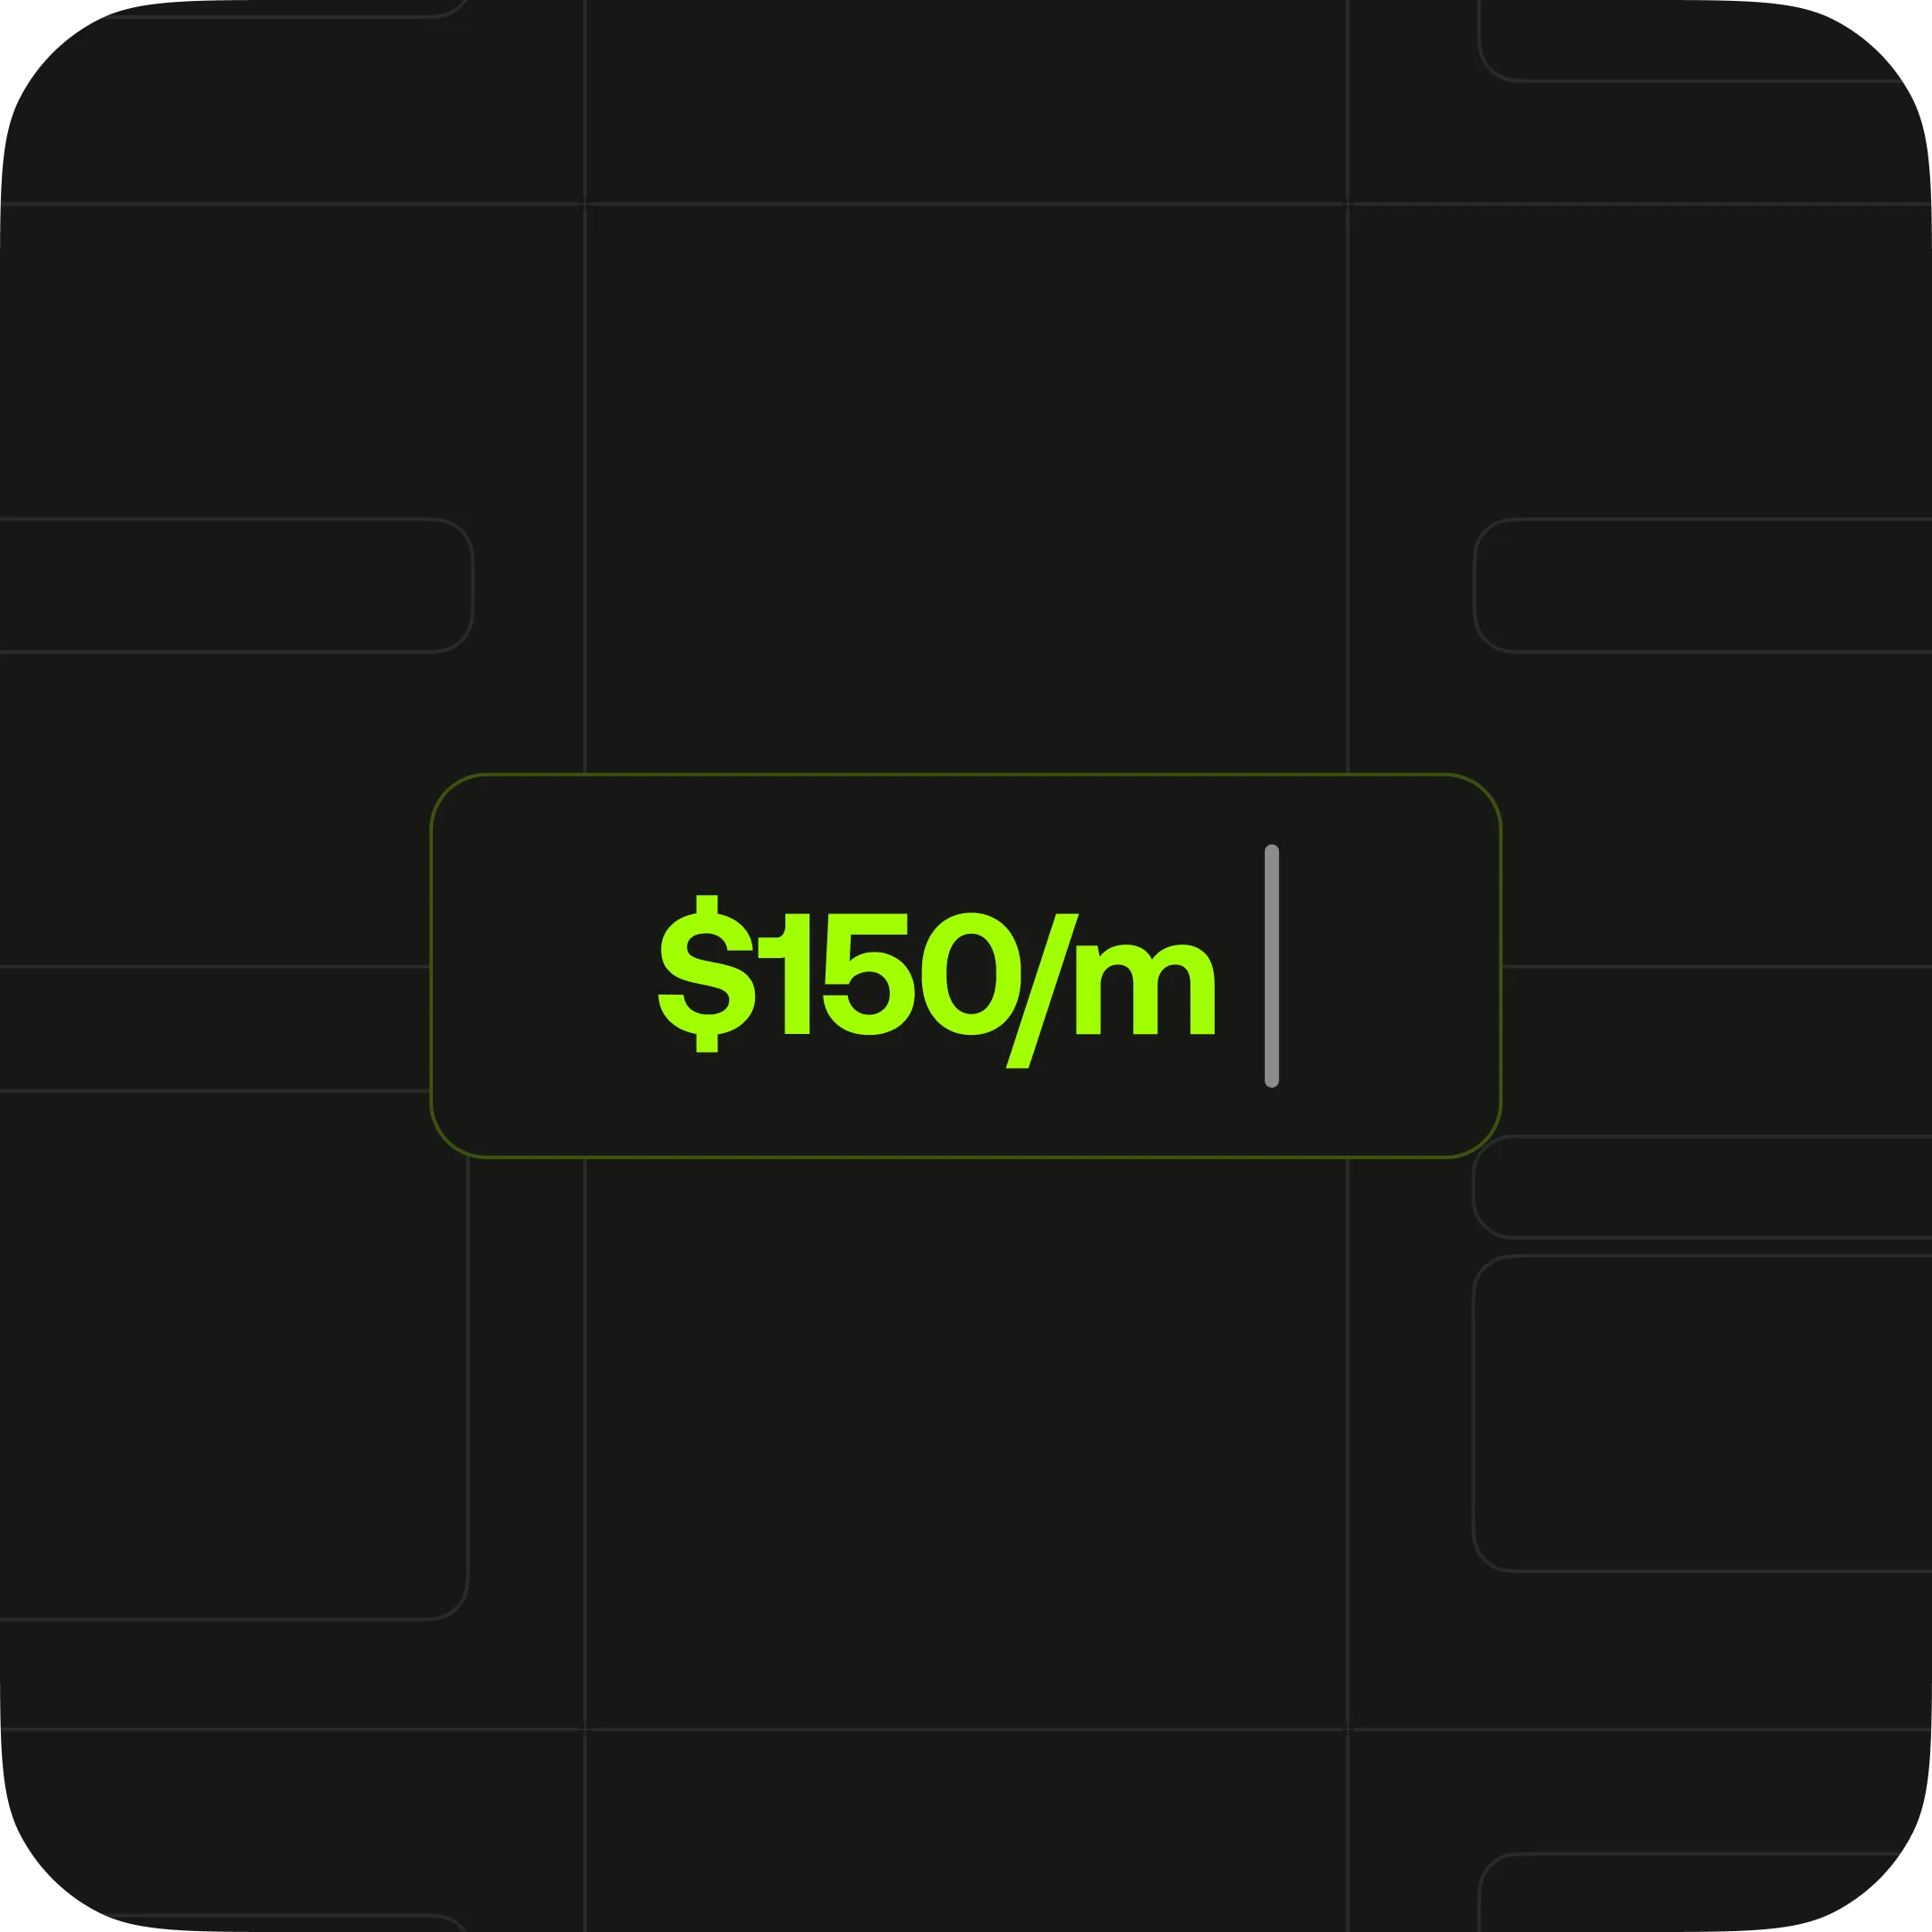
Step 2
Add your monthly contribution
Consistency matters far more than size.
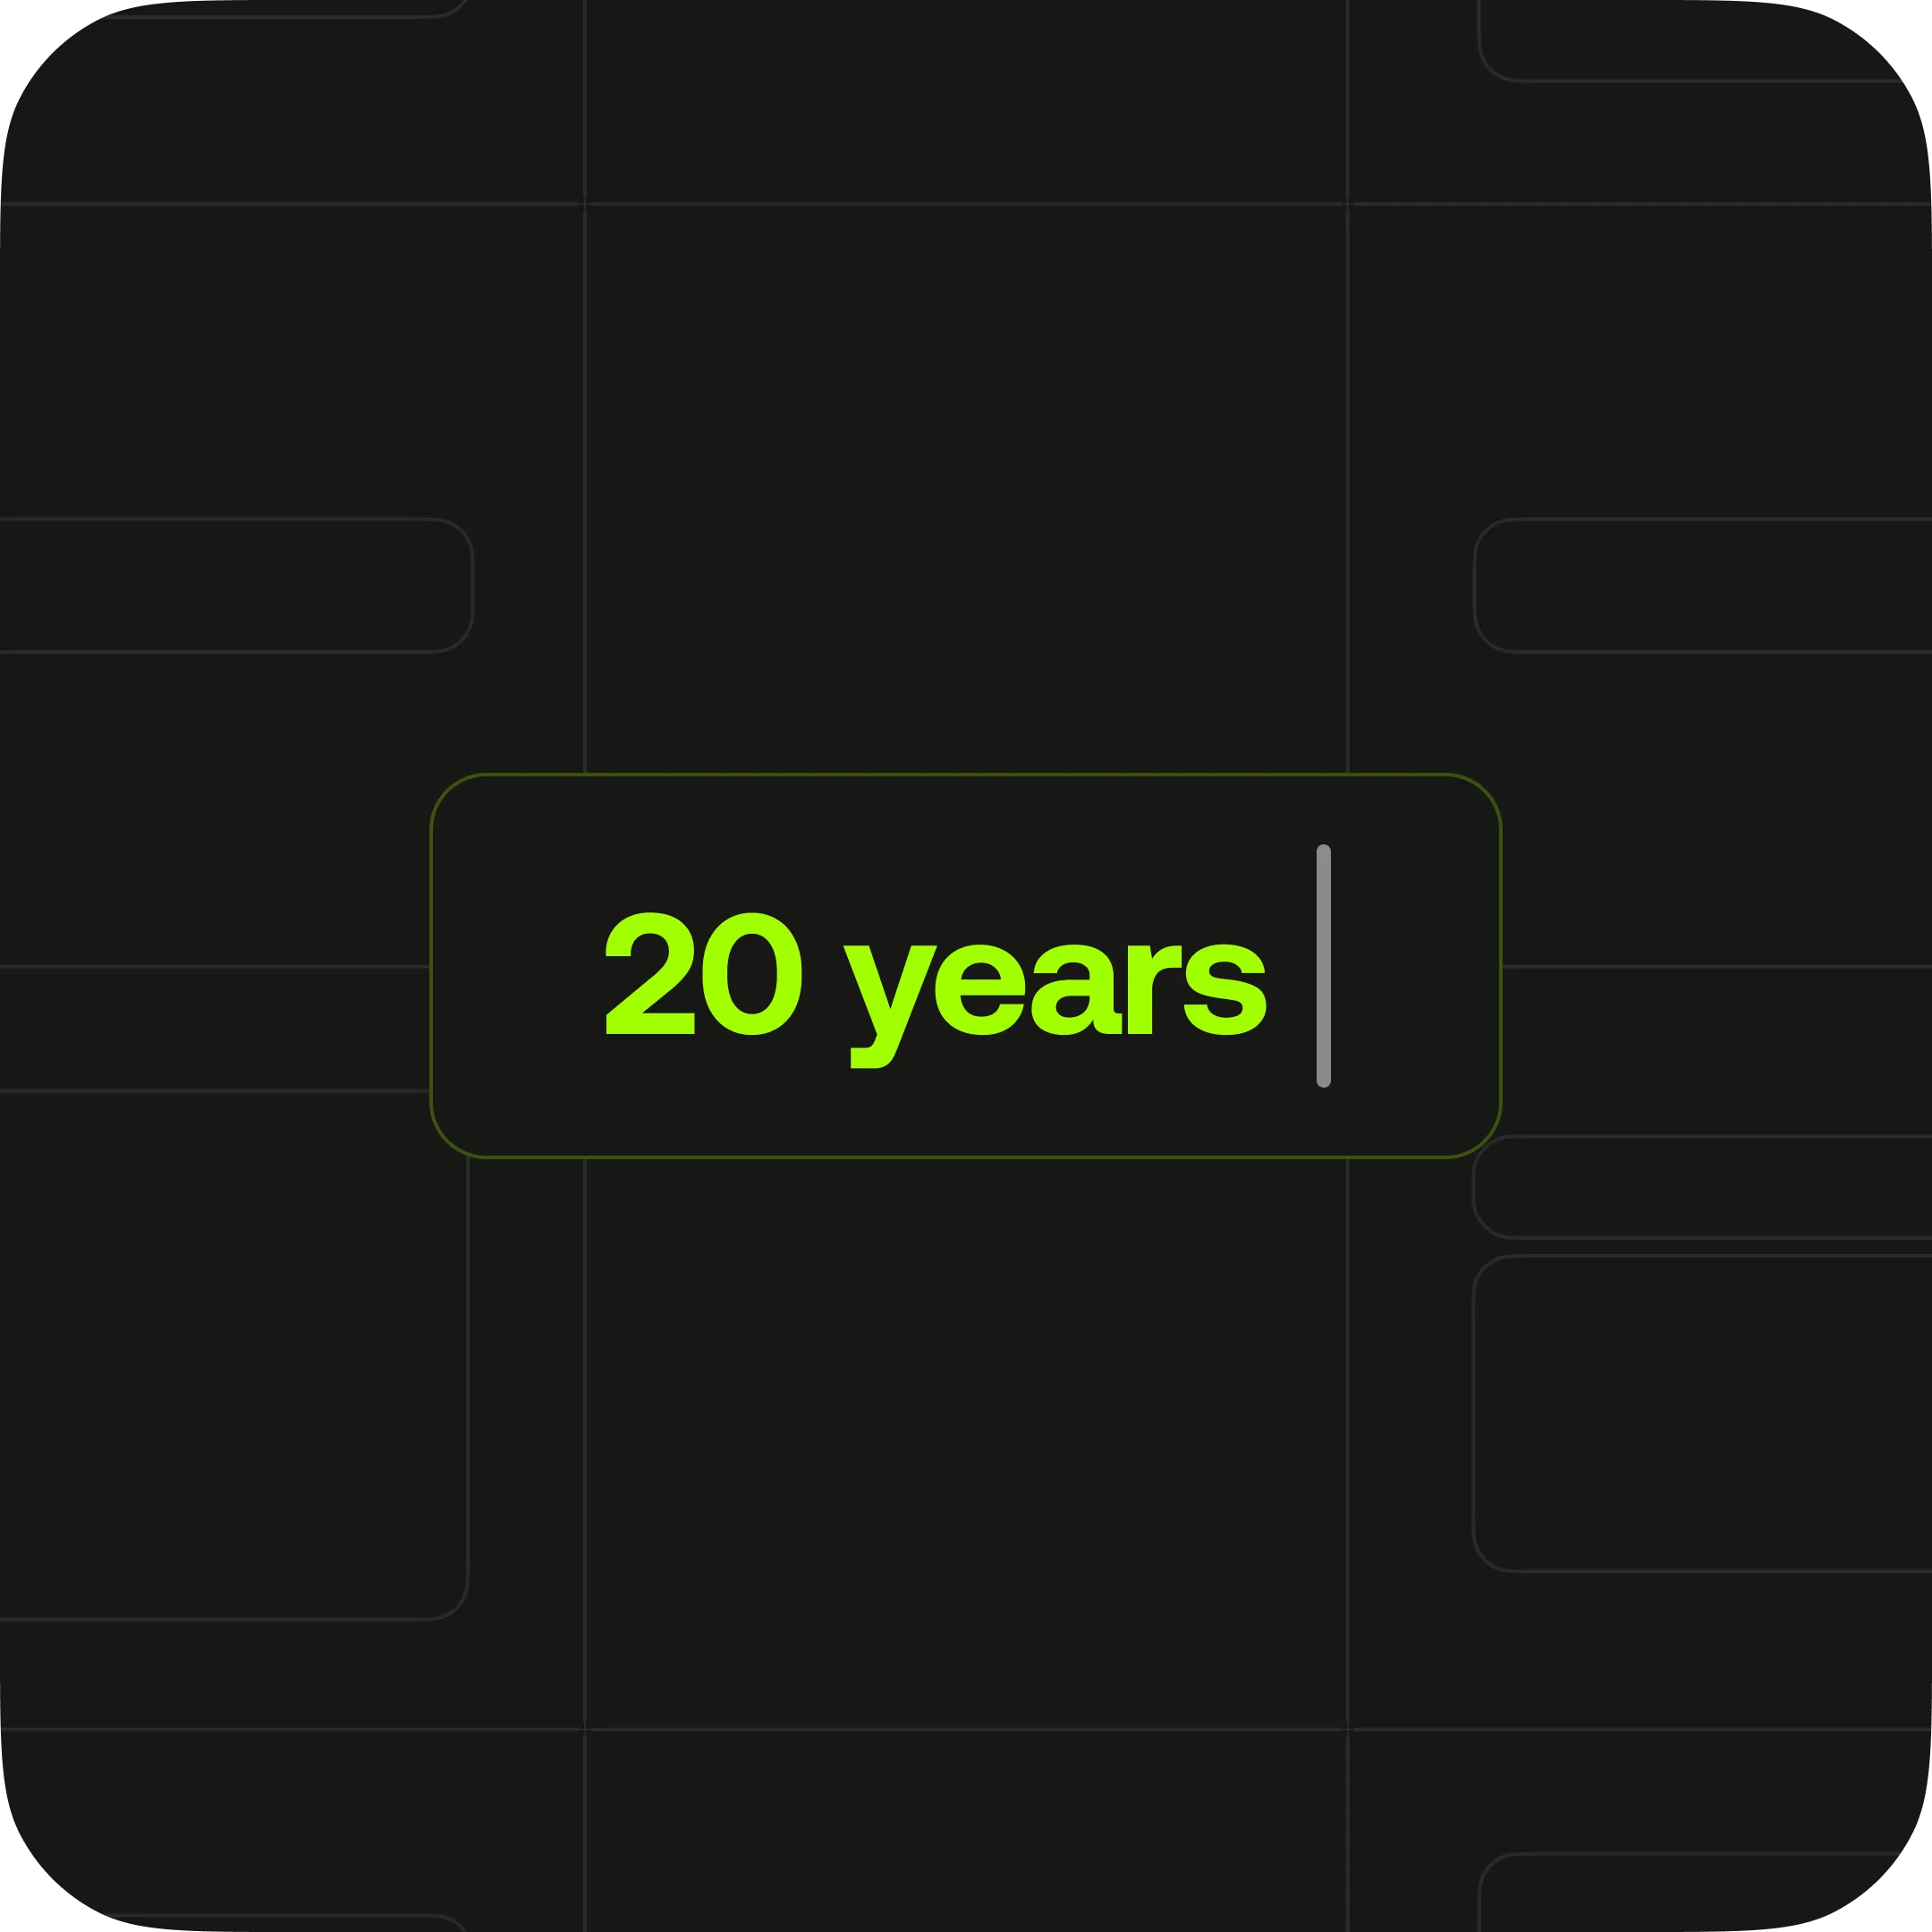
Step 3
Set your time horizon
Longer horizons dramatically change the outcome.
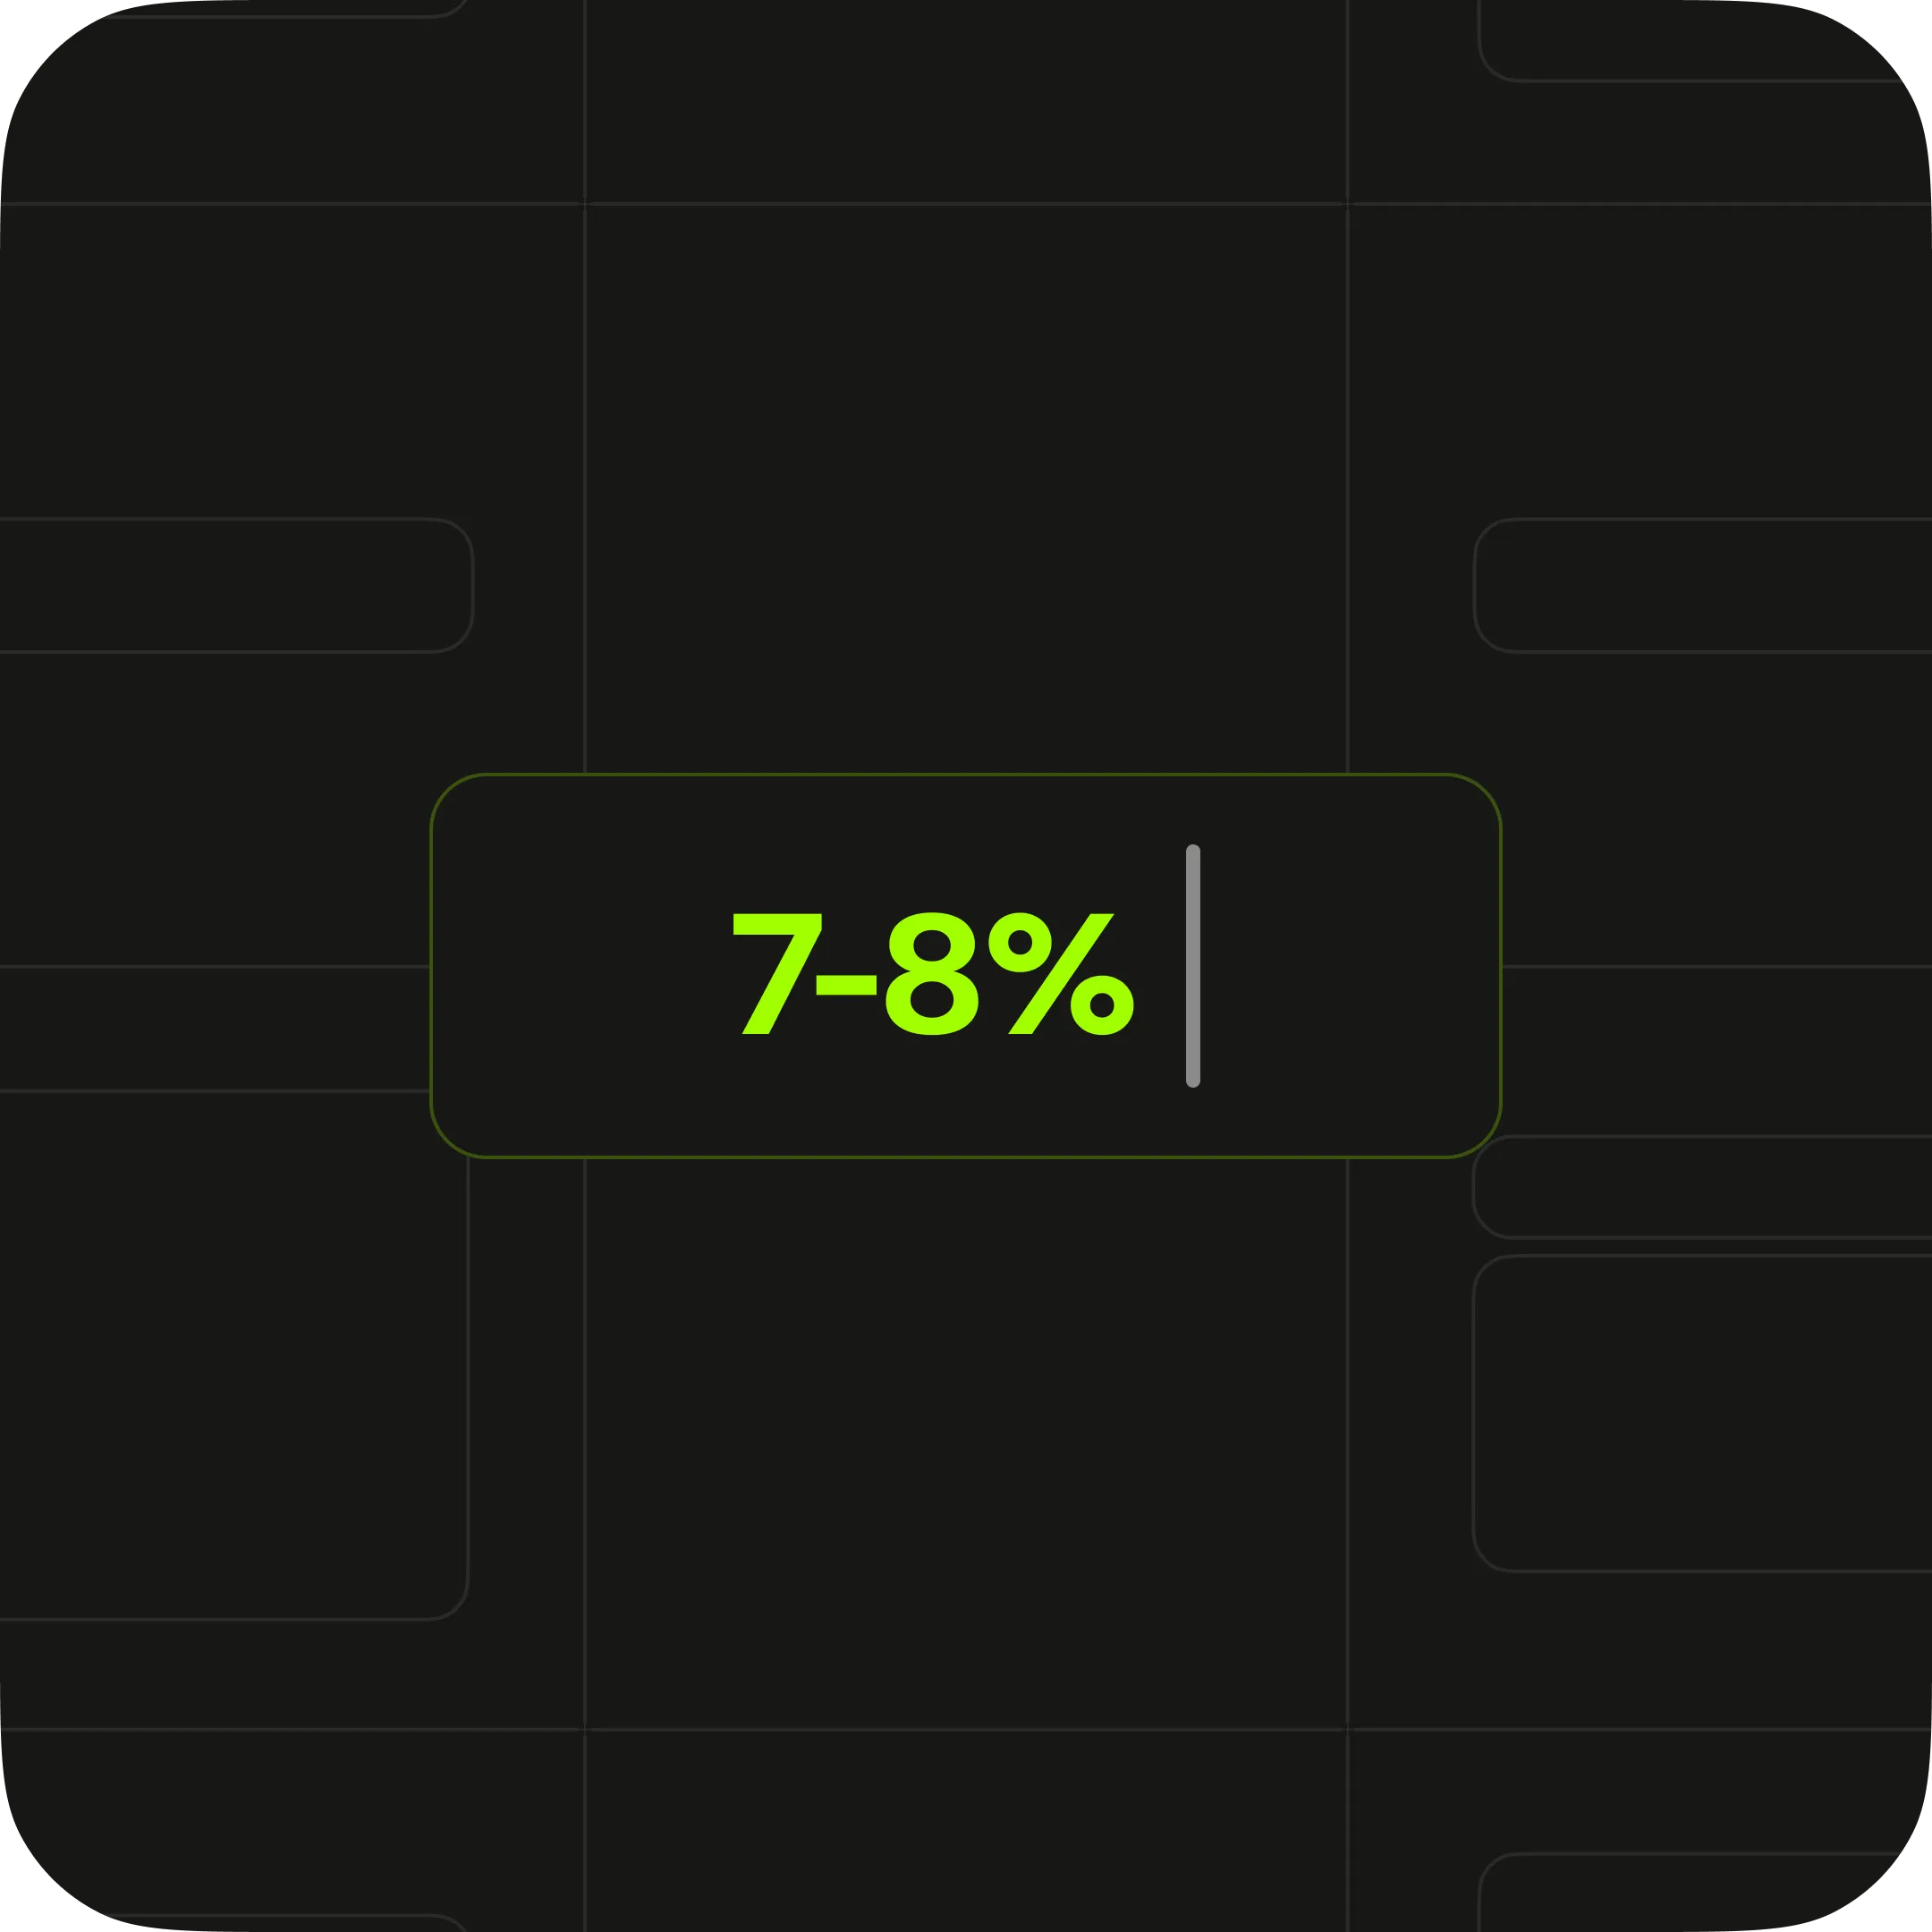
Step 4
Pick a return rate
Or take the short risk questionnaire and let the tool suggest one.
Understanding your results
BON Credit brings all your important credit information into one intelligent dashboard designed to help you stay in control.
Time
Compounding rewards patience more than it rewards large deposits. Money invested in your twenties has decades to grow on itself; the same amount invested at 45 simply doesn't.
Contributions
For most people starting out, regular monthly contributions do more heavy lifting than the return rate. Increasing what you add each month is the most controllable lever you have.
What is it really costing you?
Important, but not something you control and the number you assume matters enormously to the projection, which is why the next section deserves attention.
What makes this an AI-powered investment calculator
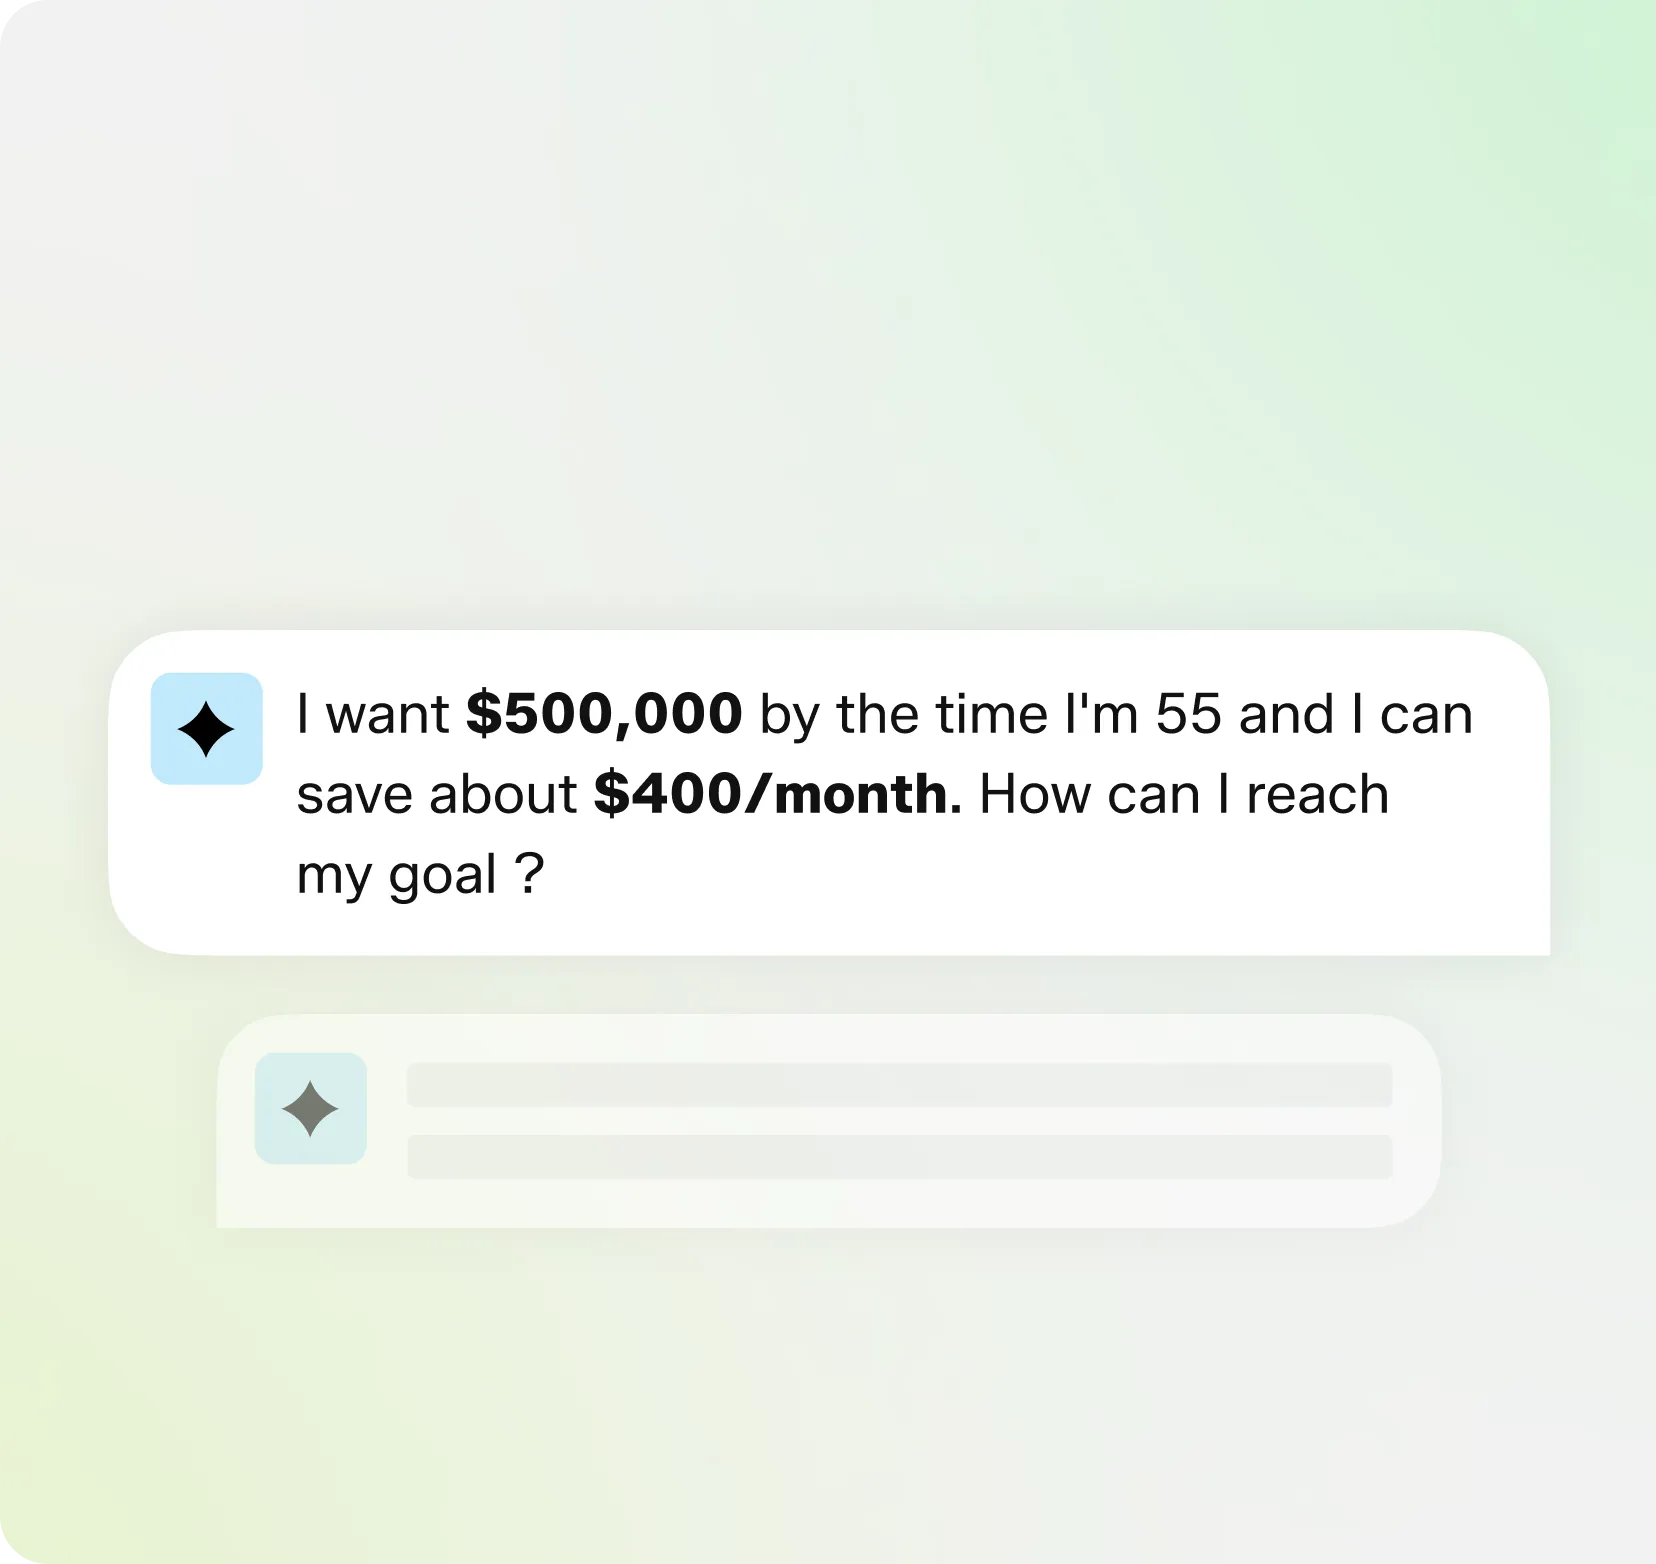
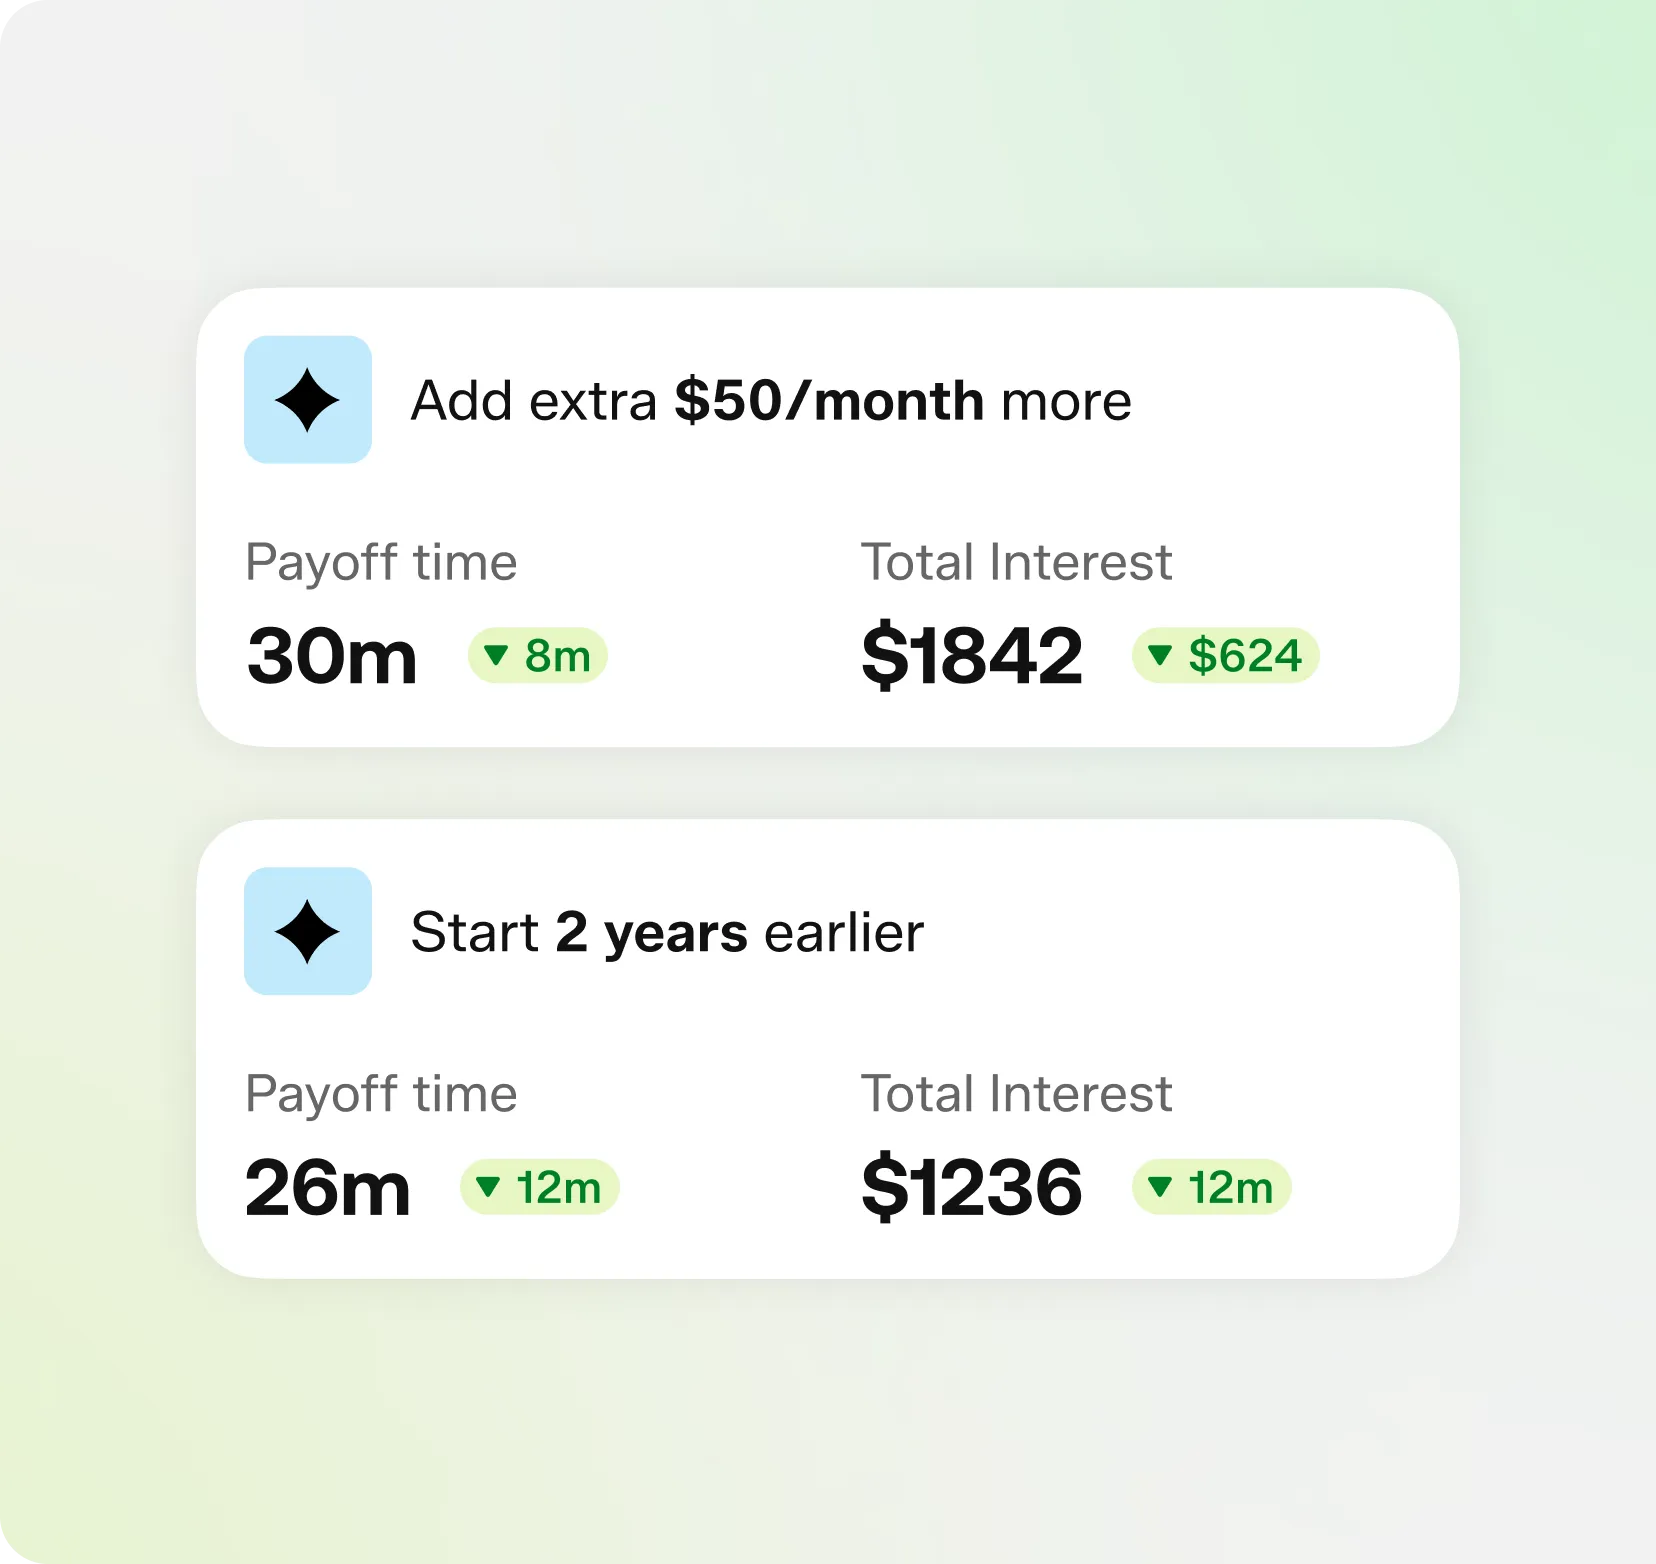
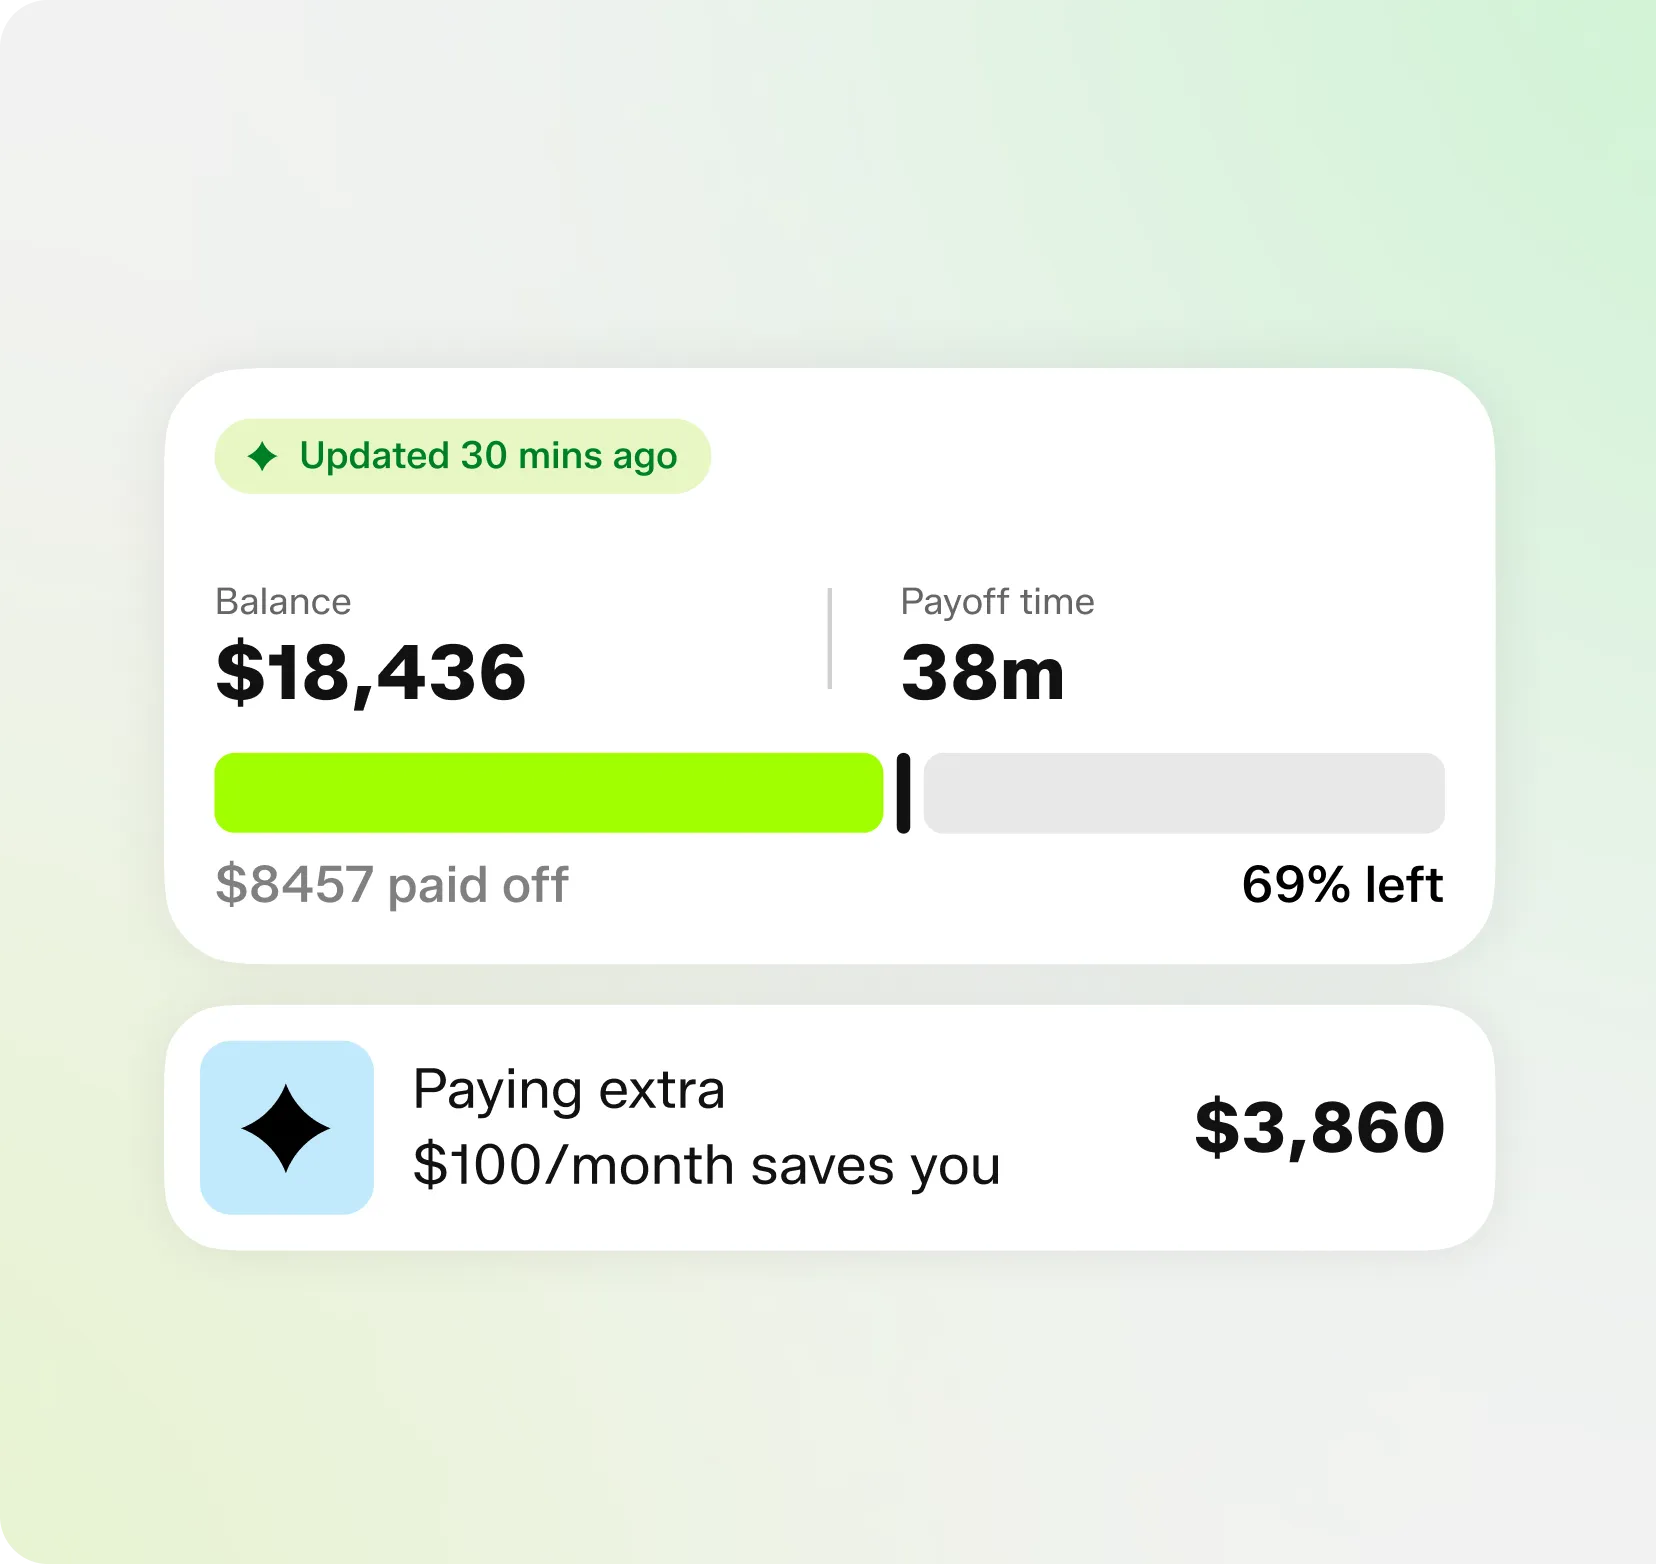
Plenty of tools slap "AI" on a compound interest calculator. Here's what the AI genuinely does in ours
What rate of return should you use?
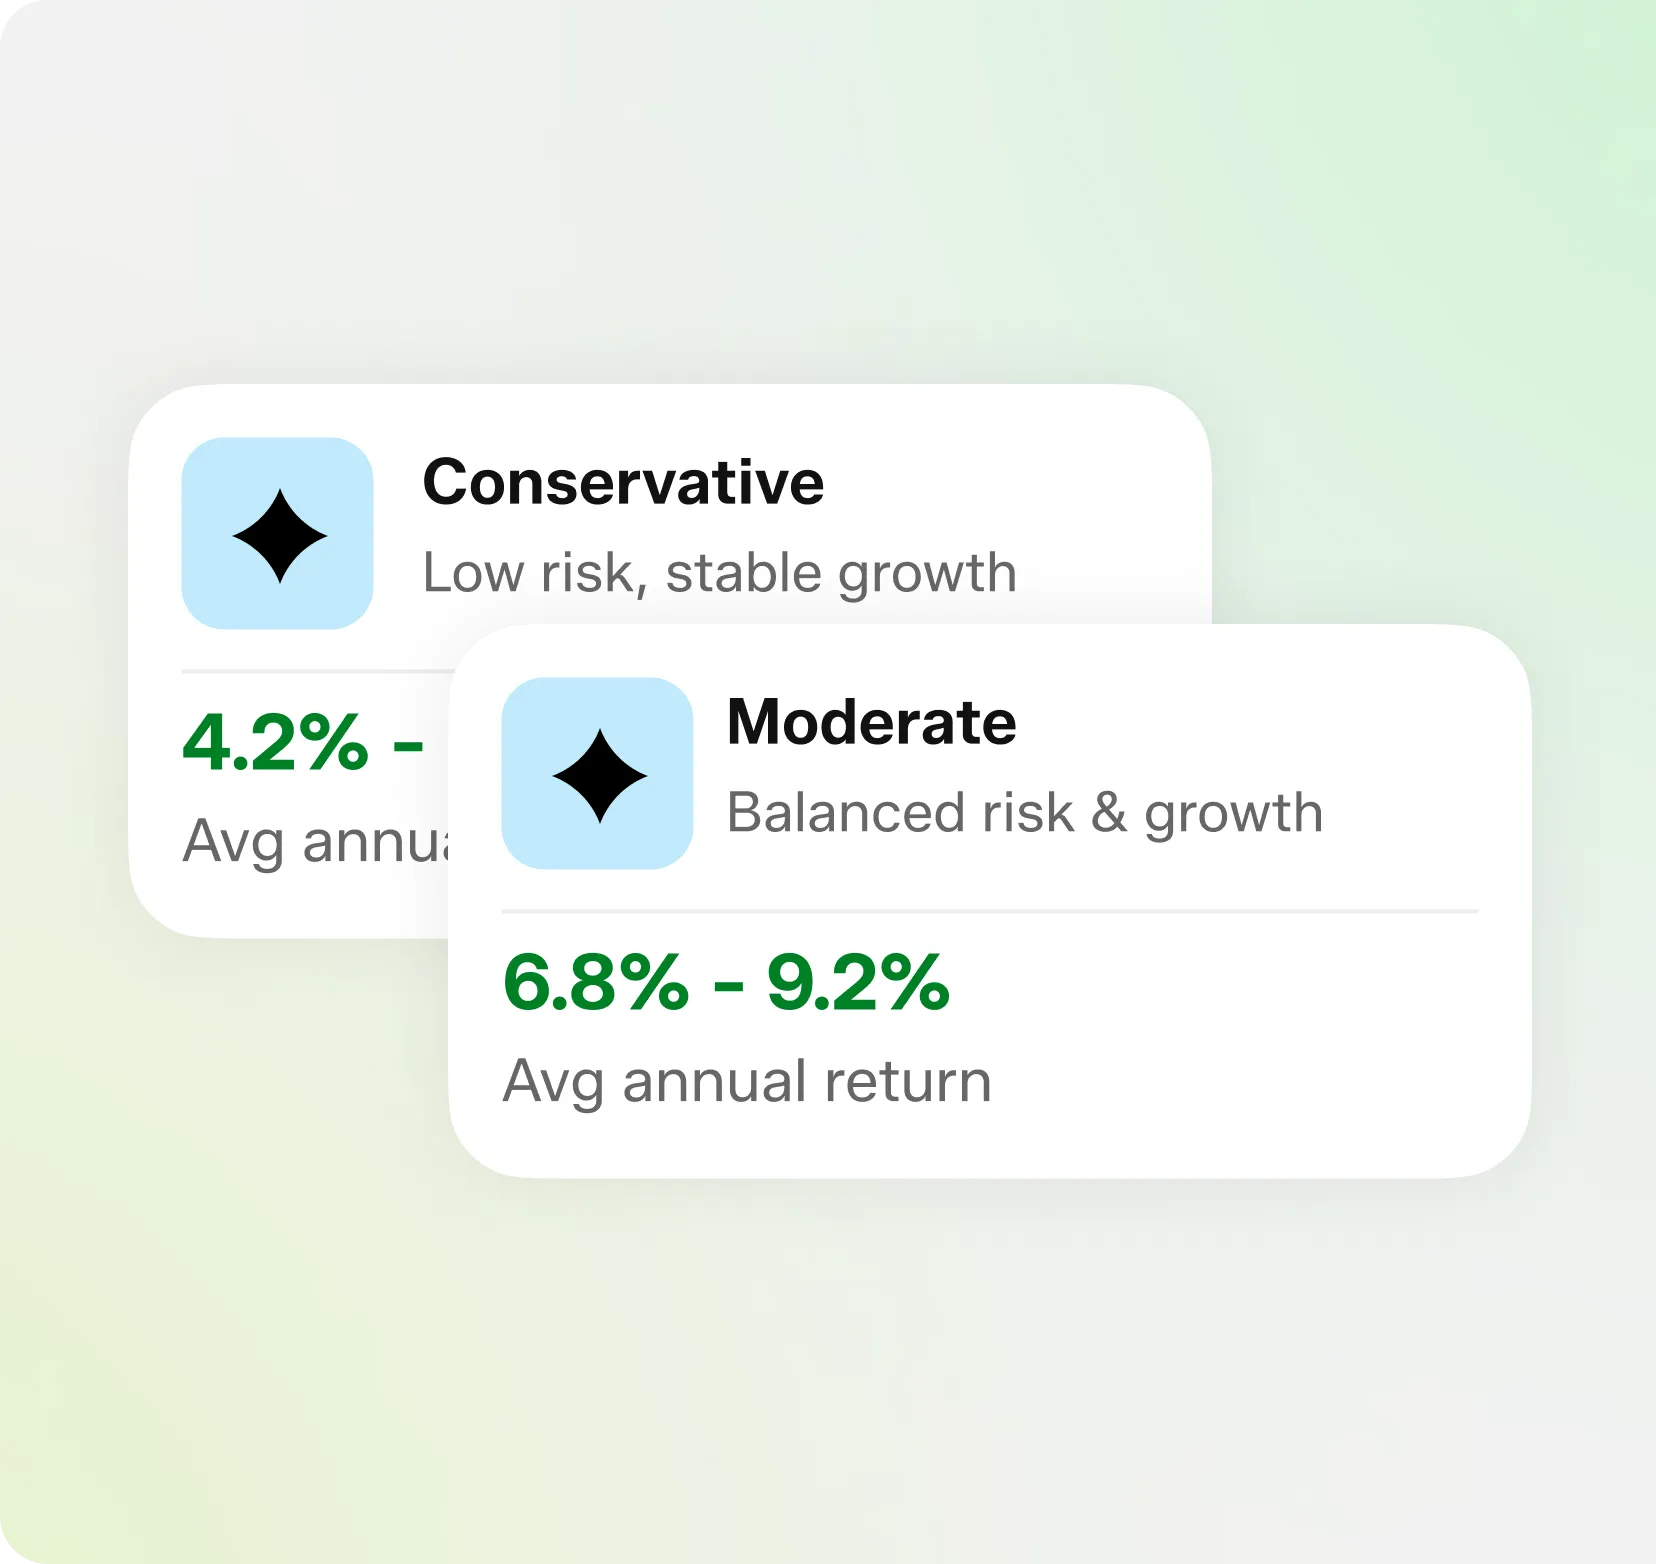
This is where beginners most often go wrong by being too optimistic.
Historically, the S&P 500 has returned roughly 10% annually over the long run before inflation — closer to 6% to 7% after inflation is accounted for. Those are long-term averages across nearly a century, and they include severe crashes along the way. Individual years look nothing like the average.
For planning purposes, use a conservative figure. Many major financial sites default to 5% or 6% for exactly this reason. Run your projection at a few different rates and treat the lower one as your realistic case. A plan that only works at 12% isn't a plan.

Getting started as a beginner
You don't need thousands of dollars. Fractional shares mean you can start with as little as $1, and most brokerages have no minimum.

Index funds and ETFs
These spread your money across hundreds of companies at once, which is why they're the standard recommendation for beginners

Dollar-cost averaging
Investing a fixed amount on a schedule — removes the temptation to time the market

Roth IRAs
Roth IRAs let your money grow tax-free, which is especially valuable when you're young and in a lower tax bracket.

Time in the market
Time in the market consistently beats trying to pick the perfect entry point
![[object Object]](/_next/image?url=%2Fimages%2Fcalculator%2Fai-investment-calculator%2Fdebt-vs-invest-emergency-fund.webp&w=3840&q=75)
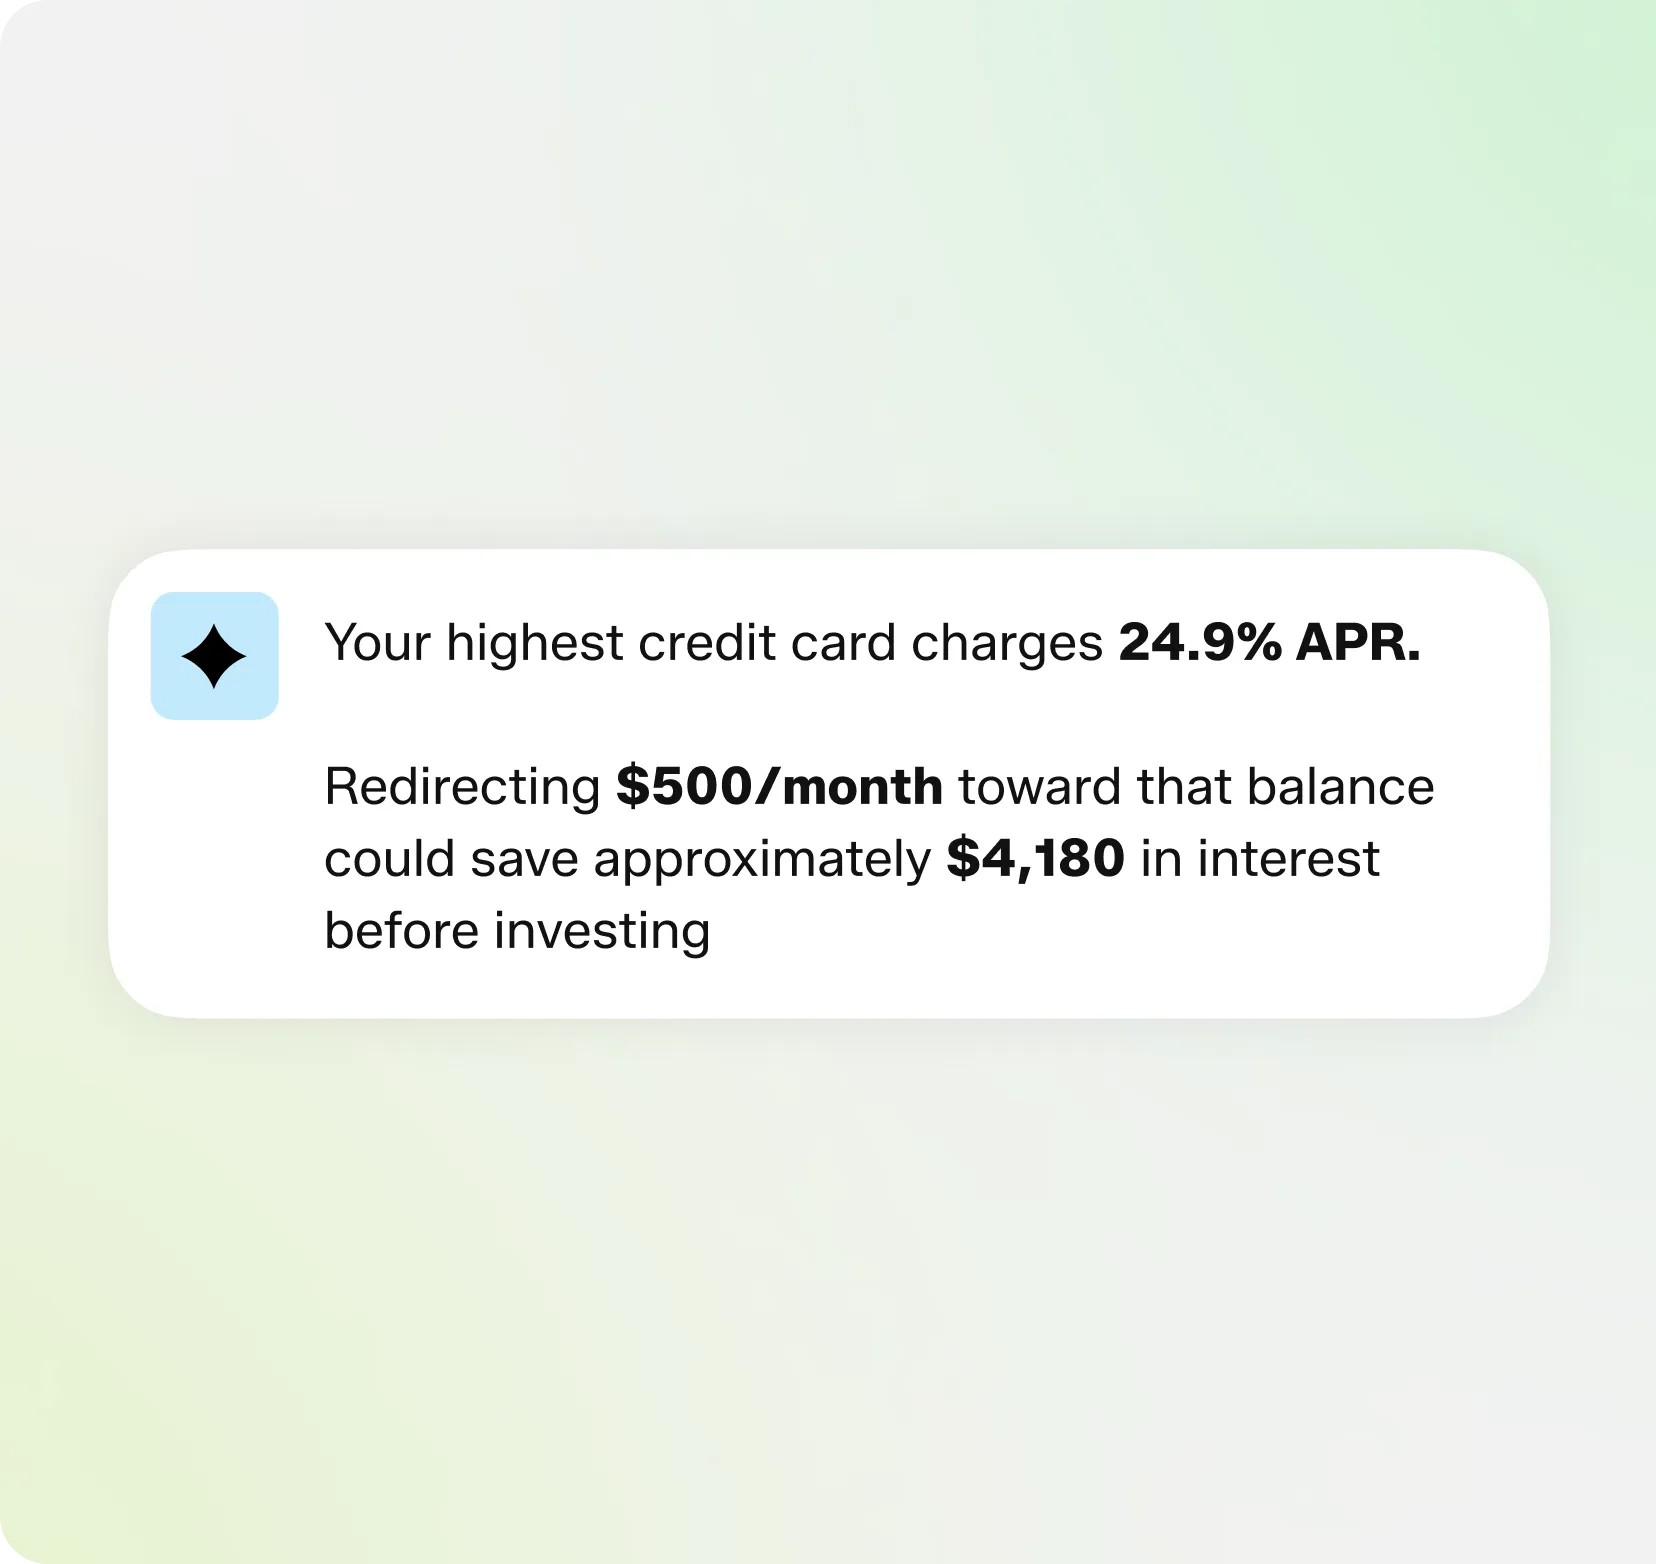
Should you pay off debt or invest first?
Paying off a card charging 21% is effectively a guaranteed 21% return, which almost no investment can match reliably. A stock market return of 7% to 10% is an expectation, not a promise.

Contribute enough to get any employer 401(k) match (that's free money)

Clear high-interest credit card debt

Then invest seriously

Methodology and assumptions
The calculator uses the standard compound growth formula with monthly contributions applied at the end of each period and returns compounded annually unless you select otherwise. Projections assume a constant rate of return and uninterrupted contributions.
Taxes, brokerage fees, and fund expense ratios are not deducted. Inflation adjustment is optional — toggle it on to see results in today's dollars. Real-world returns vary year to year and will not follow a smooth curve